

InsightsAI
DESIGNED FOR WEB


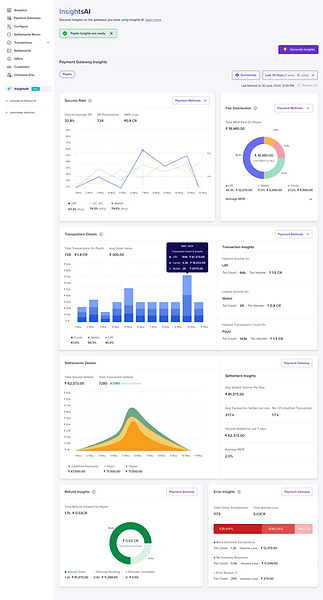
WHAT IS INSIGHTS AI?
FlowWise helps merchants route payments across multiple gateways, but merchants lacked visibility into how their transactions performed—which gateway had the best success rate, how much they were paying in fees, or why certain transactions failed. Without these insights, merchants were making blind decisions, often leading to revenue loss.
InsightsAI was introduced as a free, value-added service within FlowWise, designed to eliminate guesswork by offering merchants a unified analytics dashboard—no integration required.
The goal was to empower merchants with actionable data to increase success rates, optimize costs, and improve payment efficiency.
MY ROLE
Designing the feature end-to-end, working closely with engineering to craft video experiences in detail.
THE TEAM
Solo designer, with guidance from a Senior Design Director, 1 Product Manager, 4+ engineers.
TIMELINE
About 4 Weeks, Released by 25 Dec, 2024
KEY INSIGHTS


Business Settlement Details: Across all payments gateways


Business Settlement Details: Across all payments gateways
Business Settlement Details: Across all payments gateways


ANALYTICS COLOR TOOLKIT
MY DESIGN APPROACH
To build a powerful yet intuitive analytics experience, I focused on:
🔹 Data Simplification – Payments data is complex. I designed a modular dashboard that displayed key insights without overwhelming the user.
🔹 Progressive Disclosure – Instead of showing all data at once, I structured the interface to reveal insights gradually, starting with high-level trends and allowing merchants to drill down into details.
🔹 Actionable Insights – Each graph and metric was paired with contextual tooltips, recommendations, and benchmarks, helping merchants make sense of the data and act on it.
🔹 Smart Data Visualizations – Used time-series graphs, heatmaps, and comparison charts to make trends obvious at a glance.
🔹 Frictionless Experience – Unlike traditional analytics dashboards, InsightsAI didn’t require additional integration—merchants could start analyzing their data immediately.


SUCCESS RATE
A time-series graph showing fluctuations in transaction success rates across different gateways.


TRANSACTION VOLUME ANALYSIS
A bar-graph showing volume of transactions across different gateways.
ACROSS GATEWAY SETTLEMENT ANALYSIS
A area graph for settlement pattern across different gateways.


ACROSS GATEWAY SETTLEMENT ANALYSIS
A area graph for settlement pattern across different gateways.
ACROSS GATEWAY SETTLEMENT ANALYSIS
A area graph for settlement pattern across different gateways.
REFUND INSIGHTS
A area graph for settlement pattern across different gateways.

Merchants were struggling to optimize their payment strategy due to lack of visibility into key performance metrics like success rates (SR), payment failures, and transaction fees.
Existing dashboards on payment gateways were fragmented, forcing merchants to log in to multiple platforms to analyze their data.
FlowWise needed a way to cross-sell its smart routing capabilities—InsightsAI had to be designed as an onboarding and engagement tool that nudged merchants toward adopting FlowWise.
IMPACT & RESULTS
-
🚀 Increased Engagement: By providing merchants instant insights, InsightsAI increased FlowWise engagement, making merchants more aware of their transaction inefficiencies
-
🎯 Stronger Cross-Sell Opportunities: By showcasing how FlowWise could improve SR and cost efficiency, InsightsAI became an indirect driver for merchant adoption.
-
🔄 Faster Merchant Activation: Since InsightsAI was available without extra setup, it became an easy entry point for merchants who hadn’t fully onboarded to FlowWise yet.